A faster alternative to PageSpeed Insights: audit any website without leaving the tab
PageSpeed Insights, Lighthouse and GTmetrix force you to switch tabs. The Web Vitals extension by VANTAG audits Core Web Vitals, SEO, accessibility, server, DNS and tech stack in a single popup. Free and open source.
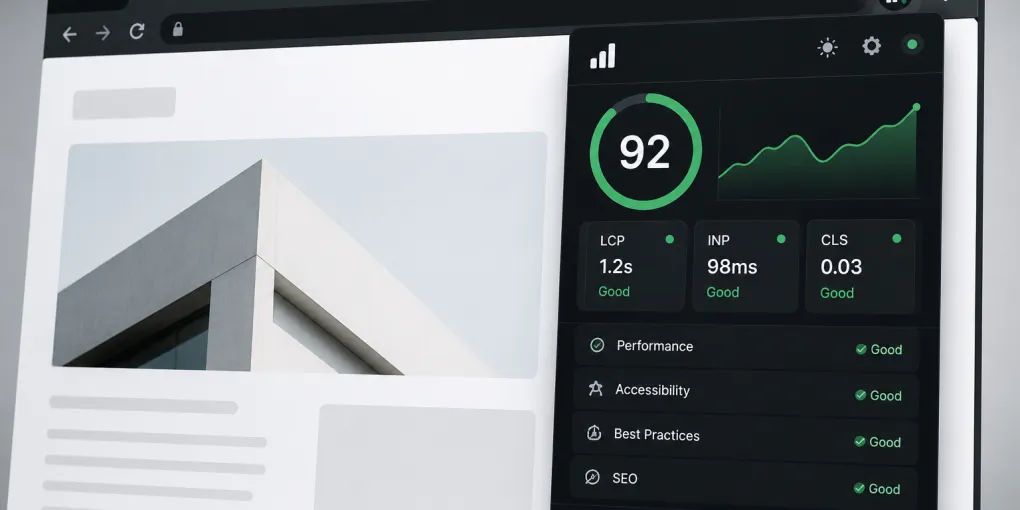
Auditing a website’s performance with Google’s own tools is a familiar ritual: open PageSpeed Insights, paste the URL, wait 20 seconds, look at the report, close the tab. Repeat for the next site. Repeat for the mobile version. Repeat every time you change something.
It’s a slow flow for what should be a three-second check. And it only covers Core Web Vitals: if you also need to see the server, the DNS, the tech stack or the accessibility level, that’s three more tabs.
That’s why we ship the Web Vitals Chrome extension: a single popup with six tabs that summarises in seconds what used to take five different tools. It’s a maintained fork of Google’s official extension, extended with the tabs that were missing.
What it measures in a single popup
Six tabs, all local, without leaving the page you’re on:
Web Vitals. LCP, CLS, INP, FCP and TTFB in real time, colour-coded (good / needs improvement / poor) and compared against Chrome UX Report field data. When a metric fails, the extension suggests the concrete fix (“Preload your hero image”, “Reserve space for ads to reduce CLS”).
Server Info. IP address, geolocation (country, region, city), ISP, organisation, ASN, timezone and hostname. Handy for finding out where a site is hosted without opening dig or a whois lookup.
DNS Info. A, AAAA, MX, NS, TXT, SOA and CNAME records via Google Public DNS. Subdomain discovery when available.
SEO. 0-100 score based on title, meta description, headings, images, structured data, Open Graph and security headers. Includes Domain Authority and Domain Rating estimations, content analysis (word count, heading structure, alt text, internal and external links) and fix suggestions for every issue found.
Tech Stack. Automatic detection of CMS and SSGs (WordPress, Next.js, Hugo…), server software (Nginx, Apache), JavaScript frameworks and libraries, analytics and marketing tools, font providers. No BuiltWith, no Wappalyzer.
A11y. 0-100 score with estimated WCAG compliance level (A, AA, AAA). Detects missing alt text, empty links and buttons, unlabelled form inputs, skipped heading levels, missing landmarks and positive tabindex values. Every issue ships with the exact fix.
Plus: one-click Markdown export (auto-loading tabs you haven’t opened yet), dark/light mode with persistent preference, and Chrome’s side panel support to keep it visible while you browse.
Web Vitals vs PageSpeed Insights vs Lighthouse
None of them replaces the others. Each has its moment.
| Web Vitals (extension) | PageSpeed Insights | Lighthouse (DevTools) | |
|---|---|---|---|
| Where it lives | Browser popup | External web app | DevTools |
| Time per run | Instant | 15-30 s | 30-60 s |
| Lab data | Yes | Yes | Yes |
| Field data (CrUX) | Yes | Yes | No |
| Server / DNS / IP | Yes | No | No |
| On-page SEO | Yes | Basic checklist only | Yes (audits) |
| Accessibility | Yes (WCAG A/AA/AAA) | No | Yes (axe-core) |
| Tech stack | Yes | No | No |
| Exportable report | Markdown (1 click) | Share URL | JSON/HTML |
| Batch URL runs | No | Yes (API) | Yes (CLI) |
| Requires opening DevTools | No | No | Yes |
Use PageSpeed Insights when a client asks for “the official Google report” or when you need the API to process hundreds of URLs.
Use Lighthouse when you’re debugging a specific performance issue and need the exhaustive audit (unused JavaScript, specific opportunities, PWA, best practices).
Use the Web Vitals extension for everything else: check a site’s health in five seconds, audit a competitor without leaving their page, verify that a deploy hasn’t broken metrics, export a complete technical snapshot for a proposal.
Use cases where it saves the most time
Competitor analysis. Open the competitor’s site, click the icon, and you already know: what server they run on, which CMS they use, how their real-user Core Web Vitals look, their on-page SEO score, and whether the site is accessible. That used to be five tools.
Express audit for a proposal. A prospect sends you their URL. In ten seconds you export the Markdown report and paste it into the proposal. No need to run a Lighthouse or fire up SEMrush.
Post-deploy sanity check. You push a change to production. Instead of waiting for CrUX to update or opening DevTools, a glance at the popup confirms that LCP and INP are still green both on your machine and in field data.
Quick accessibility audit. It doesn’t replace axe DevTools or manual testing, but for spotting the obvious failures (images without alt text, unlabelled forms, skipped headings) it’s an instant first pass.
Infrastructure debugging. A site is slow but you’re not sure whether it’s the site or the hosting. The Server Info tab tells you the ISP, location and ASN. If the server is in Singapore and your users are in Europe, you know where to start.
Privacy: why this matters in the EU
Many analysis extensions send every URL you visit to their servers to “enrich the data”. The Web Vitals extension doesn’t. All analysis runs locally in your browser.
External API calls are limited to what the browser can’t resolve on its own:
- CrUX for real-user field data.
- ipwhois.app for IP geolocation.
- Google Public DNS for DNS records.
- Mozilla HTTP Observatory for security header scanning.
- RDAP.org for domain registration data.
None of them belongs to VANTAG. There’s no server of ours receiving your browsing history or the sites you audit. It’s open source: if you don’t trust our word, the code is published under Apache 2.0 and you can read it. For teams in the EU dealing with GDPR compliance, this matters — the extension is safe to install on work machines without triggering DPO conversations.
Installation
Two ways:
Chrome Web Store (recommended): Install Web Vitals. One click, “Add to Chrome”, done. Compatible with Chrome 114+ and with Edge, Brave and any Chromium-based browser.
Skip the store (for developers):
git clone https://github.com/vantaghq/web-vitals-extension.git
cd web-vitals-extension
npm install
npm run build
Then: chrome://extensions → enable “Developer mode” → “Load unpacked” → select the project directory.
Contributing and reporting bugs
The project is open source under Apache 2.0. If you find a bug, want a feature or have an idea for a new tab, open an issue on GitHub or start a discussion.
Current version: 2.5.0 (April 2026). Size: 209 KiB. No API keys to configure. Free, no account, no telemetry.
Frequently asked questions
How is the Web Vitals extension different from PageSpeed Insights?
PageSpeed Insights makes you copy a URL, wait 15-30 seconds and view the report in another tab. The Web Vitals extension measures Core Web Vitals in real time on the page you're already viewing and adds five more tabs (server, DNS, SEO, tech stack, accessibility) that PageSpeed doesn't cover. It doesn't replace Lighthouse for deep audits, but for quick diagnostics and competitor analysis it's several times faster.
Does it show data from my machine or from real users?
Both. Core Web Vitals metrics are measured in your browser (lab data) and in parallel the extension queries the Chrome UX Report (CrUX) for real-user field data from the latest period. Seeing both side by side tells you whether a problem is a one-off on your machine or chronic in the wild.
Is it a fork of Google's official extension?
Yes. VANTAG's Web Vitals extension is based on Google Chrome's official open-source project (GoogleChrome/web-vitals-extension), released under Apache 2.0. Google discontinued active development; VANTAG maintains the fork and has added the Server, DNS, SEO, Tech Stack and A11y tabs, plus Markdown export, dark/light mode and side panel support.
Does it send my browsing data to any server?
No. All analysis runs locally. The extension queries public APIs for data the browser can't get on its own (CrUX for field data, ipwhois.app for geolocation, Google Public DNS for DNS records, Mozilla HTTP Observatory for security headers, RDAP.org for whois). There's no analytics, no tracking, no VANTAG-owned server receiving your browsing history.
Do I need an API key?
No. The CrUX API key ships with the extension and only works inside the extension context, matching the behaviour of Google's original version. The rest of the APIs require no authentication.
Does it replace Lighthouse or the Chrome DevTools performance panel?
No. Lighthouse runs deeper audits (unused JavaScript, specific opportunities, PWA, best practices) and the DevTools performance panel is essential for detailed profiling. The Web Vitals extension is built for the daily flow: reviewing a site, auditing a competitor, checking that a deploy hasn't broken metrics, exporting a quick technical report for a client.